Fourier Analysis: Drawing Llamas with Circles
The Fourier transform is a method of transforming an input signal from the time domain to the frequency domain. It has a huge range of applications, for instance audio engineers can pick out individual undesired frequencies in a song with the Fourier transform and then get back the sound without that frequency using the inverse Fourier transform. We can make use of the Fourier transform in digital image processing for filtering images, like gaussian blurs and compressing images using the JPEG format. Lastly, as this article will go into: drawing!
What am I talking about by drawing? Well, the idea is that we can take a path that represents something such as a fish, the pi symbol, or just about anything else we can draw by putting pencil lead down on a piece of paper and sketching a picture without lifting the pencil until completion. Using this path we can connect a bunch of vectors rotating in circles at different frequencies tip to tail and the last vector’s tip will draw out our original sketch, or at least something very closely resembling it.
Here are a few examples of what I am talking about:

Fig. 1 Drawing a line with circles
So you can draw a straight line using a shape that is about as far opposite from a straight line as possible. By modifying the circles you can change the shape that is drawn. For example, by decreasing the radius of the outer circle and increasing the speed it spins at, we can draw a square.
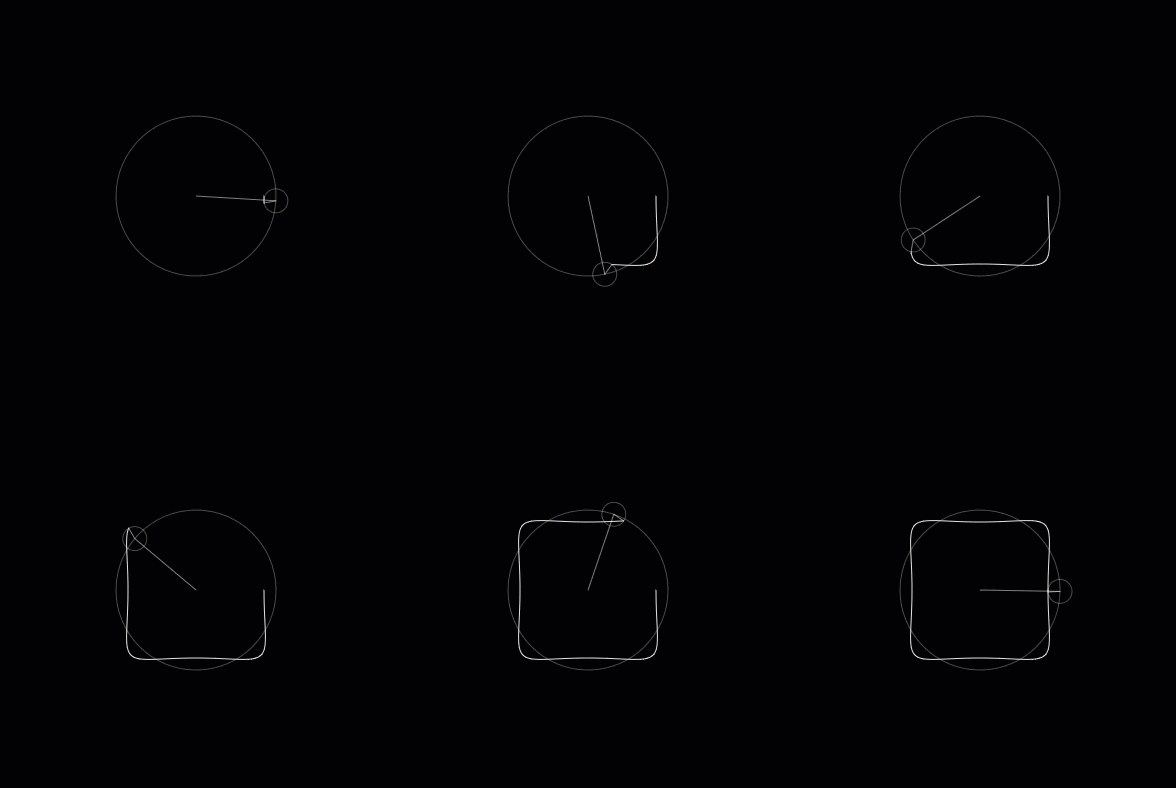
Fig. 2 A square
So what happens, then, if we add a third circle? It will allow our curves to get more sophisticated. Using a third circle we can draw a curve that looks like a fish.
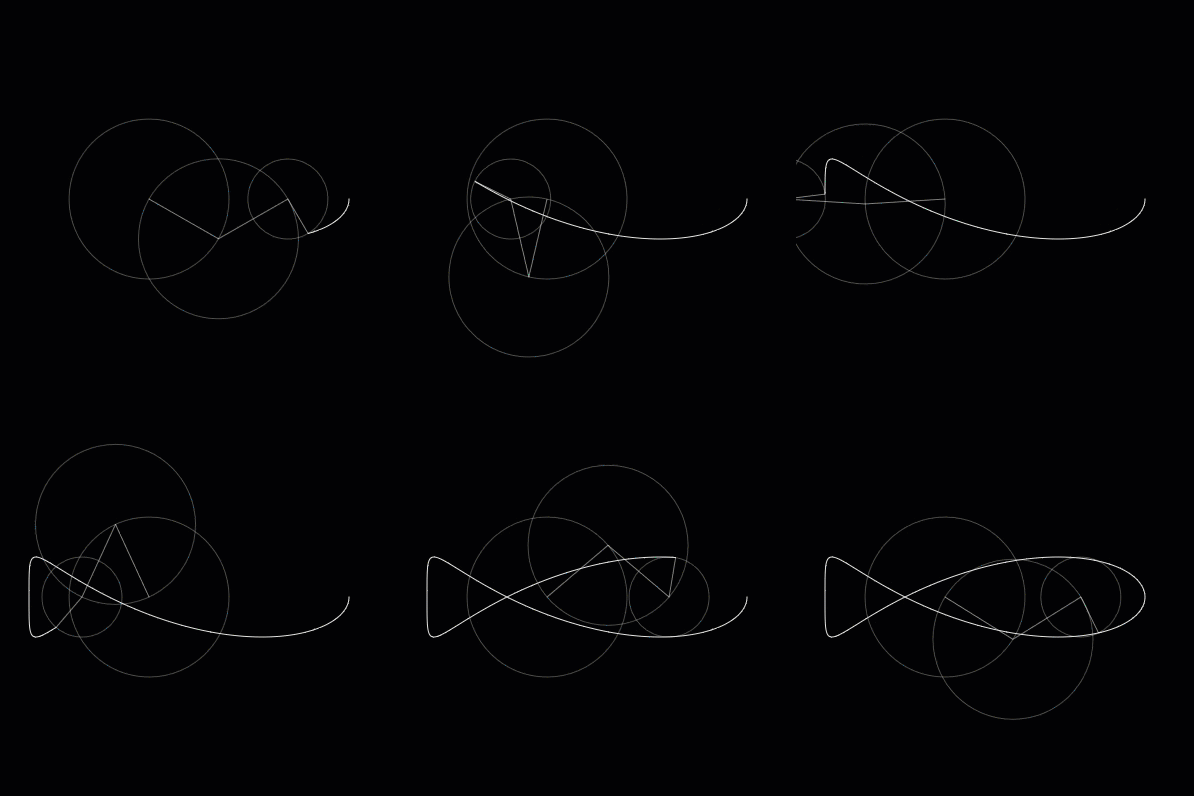
Fig. 3 A fish.
For a more extreme example of what is possible using only circles connected to other circles, here’s a llama being drawn using \(1024\) circles each with different frequencies, radii, and start angles. In general (most) every closed curve can be drawn using circles, called epicycles.
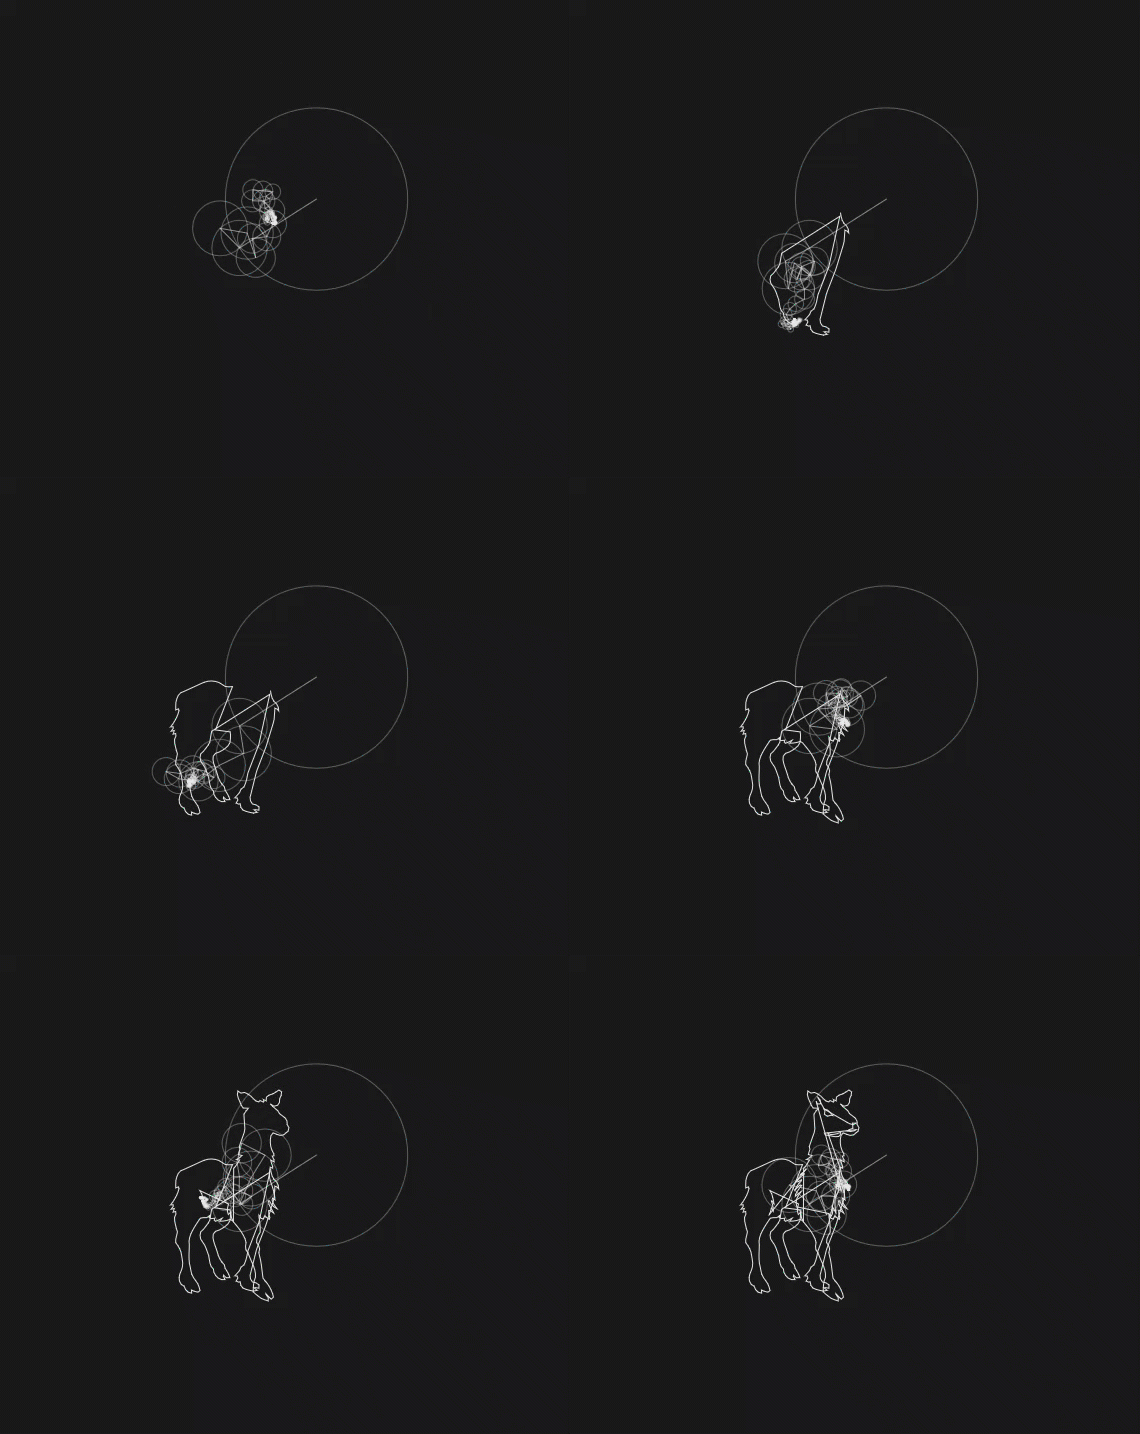
Fig. 4 A llama?!
In general, the more circles that we add, the more complicated the drawings we can produce. Also, the more circles we add for the same drawing, the better it will resemble the original “input” drawing. In order to understand what creates that animation, we will need to go into some of the underlying math and intuition behind the Fourier transform (and series). As mentioned previously, there are three conditions we can modify on a circle to draw different curves. They are: the rate at which it rotates (frequency), how big the circle is (radius), and the angle it starts at (phase). All three of these conditions can be represented using a single complex number.
Here’s an example you can mess around with to visualize the effect adding circles has on the final drawing.
Fourier Transform
But first, I should probably give a quick overview of what the Fourier transform is. It is a transformation from the time domain to the frequency domain. What does this mean? If we have a function, \(\sin(2\pi\times 3t)\), then the Fourier transformation of that \(\sin(2\pi\times 3t)\) function would just be a single spike at the frequency \(\pm 3\text{hz}\).
Fig. 5 The graph of \(\sin(2\pi\times 3t)\)
Fig. 6 The magnitude of \(\sin(2\pi\times 3t)\) in the frequency domain.
As expected, there are spikes at the frequency \(3\text{hz}\) and \(-3\text{hz}\). Essentially what we are doing is finding what frequencies are present in whatever we want and then combining those sine waves into an approximation of the original thing we wanted. Over the next few sections I’ll attempt to show how the Fourier transform works.
Complex Numbers
This section will be a quick refresher on what a complex number is, and can be skipped if you are already familiar with them. A complex number consists of two parts, the “real” part, and the “imaginary” part. This takes numbers we are already familiar with and essentially adds another axis to represent them with.
A complex number is written as \(3+4i\), where \(3\) is the real part and \(4i\) is the imaginary part. These two separate pieces are added together to form a complex number.
Another useful property of complex numbers here is that they can be easily thought of as two-dimensional vector where the real portion is \(x\) and the imaginary part is \(y\) in a standard point, \((x, y)\), in the two-dimensional Euclidean space. This representation is very convenient here due to the connection between trigonometry and complex exponentials. The formula that provides the link between the two is known as Euler’s Identity. This will be covered further in a later section in the article.
Linear Algebra
Linear Algebra is an important concept in understanding how we draw pictures using vectors rotating in circles. Namely, how we can represent vectors in terms of other vectors. In the standard 2D \((x, y)\) Euclidean space, we can represent all vectors in terms of the \(\textbf{x}\) and \(\textbf{y}\) unit vectors. These are typically called \(\hat{\textbf{i}}\) and \(\hat{\textbf{j}}\) (pronounced “i-hat” and “j-hat”) with \(\hat{\textbf{i}} = (1, 0)\) (the \(x\)-axis) and \(\hat{\textbf{j}} = (0, 1)\) (the \(y\)-axis). To do this we have two operations we can use: multiplication by a scalar and addition. For example, the vector \(\vec{a} = (5,-8)\) can be expressed as
This multiplication by a scalar and addition of vectors to produce another vector is known as the linear combination of a set of vectors. In this instance, that set of vectors is the unit vectors \(\hat{\textbf{i}}\) and \(\hat{\textbf{j}}\).
Fig. 7 Two vectors, \(\vec{u}\) and \(\vec{v}\) with an angle of \(90^{\circ}\) between them and both length \(1\)
But \(\hat{\textbf{i}}\) and \(\hat{\textbf{j}}\) aren’t the only vectors that can be used to represent other vectors, however. In fact, any two vectors can be scaled and added together to form any other vector as long as they are not a multiple of the other themselves. For example \((1,-1)\) and \((-2, 2)\) would not be valid since \((-2,2) = -2 \times (1,-1)\). In the above picture, we have vectors \(\vec{u} = (\tfrac{1}{\sqrt{2}},\tfrac{1}{\sqrt{2}})\) and \(\vec{v} = (-\tfrac{1}{\sqrt{2}}, \tfrac{1}{\sqrt{2}})\) which have length 1 and are orthogonal (a \(90^{\circ}\) angle between them). Neither of these vectors can be scaled to equal the other, which means they are linearly independent and therefore they can be basis vectors of the entire 2D space.
The dot product (or sometimes called “inner product”) is how we determine what number to scale vectors by to represent them in terms of the chosen vectors. In order to represent the vector \(\vec{\textbf{w}} = (0.7, 1.2)\) from the above diagram in terms of the vectors \(\vec{u}\) and \(\vec{v}\), we need to figure out what numbers to multiply them in order to form the linear combination \(\vec{w} = c_1\cdot \vec{u}+c_2\cdot \vec{v}\). Specifically, the numbers that we need from the dot product are the constant multipliers \(c_1\) and \(c_2\). Another way of thinking about this concept is that the dot product answers the question “how much of \(\vec{u}\) is in \(\vec{w}\)?” This intuition will be important later on when we go into the math behind the Fourier transform. Anyways, we can figure out what \(c_1\) is by taking the dot product of \(\vec{w}\) with \(\vec{u}\), also note that the order does not matter (e.g., \(\langle\vec{u},\vec{w}\rangle = \langle\vec{w},\vec{u}\rangle\)).
So we need to scale \(\vec{u}\) by a factor of \(1.3435\) which means it will get stretched by a factor of \(1.3435\) times its original size. Our \(\vec{u}\) component of \(\vec{w}\) (\(c_1\)) therefore is \(1.3435\).
Similarly, we need to scale \(\vec{v}\) by a factor of \(0.353553\) which means it will get shrunk (or compressed) by a factor of \(0.353553\) times its original size. Our \(\vec{v}\) component of \(\vec{w}\) (\(c_2\)) therefore is \(0.353553\).
We wind up with our linear combination being
Which is indeed equal to our original vector, \(\vec{w}\).
Fig. 8 The linear combination of \(\vec{u}\) and \(\vec{v}\) to produce \(\vec{w}\)
The dot product of any two vectors is defined as
Where \(\theta\) is the angle between \(v_1\) and \(v_2\) and \(\|\vec{v}\|\) is the magnitude of the vector. The magnitude is also known as the norm and is defined as \(\|\vec{v}\| = \sqrt{{v}_x^2 + {v}_y^2}\). That equation probably looks familiar, and that would be because it’s just the Pythagorean theorem we’ve all learned at some point in a K-12 math class.
Fig. 9 Pythagorean Triangle
The dot product also has some important properties that make it useful in our case. First, the dot product of any vector with itself is the magnitude of the vector squared (\(\vec{v_1}\cdot \vec{v_1} = \|\vec{v_1}\|^2\)). For instance,
Secondly, the dot product of vectors that are perpendicular (form a right angle where they intersect) to eachother is \(0\). This is because \(\cos(\frac{\pi}{2}) = 0\). Therefore, with \(\vec{v_1}, \vec{v_2}\) perpenicular, you end up with
With our previous intuition of “how much \(\vec{v_1}\) is in \(\vec{v_2}\)”, it makes sense for it to be \(0\) since these two vectors are orthogonal.
Inner Products of Continuous Functions
The previous section’s dot product was for the dot product of two vectors, but this definition can be extended to also be valid for continuous functions. The key difference is in the type of summation being done. As mentioned previously, the formula for a 2D dot product is
Or rather, the summation of the like terms of both vectors where the length of the vectors is finite (\(2\), in this case) so the summation is discrete. Another way of writing this equation for any dimension is
Where \(N\) is the dimension. The sigma-notation summation here is summation over a discrete interval. For instance, in a 3D space, the summation is over the interval \([1, 3]\). This summation, however, is only good for vectors in \(\mathbb{R}^n\). The formula for complex vectors of length \(n\), \(\mathbb{C}^n\), is very similar. We just need to take the conjugate of the second vector.
It’s important to note that the complex conjugate here makes this formula “antilinear in the second argument”, which is to say \(\vec{a}\cdot(\vec{b}+\vec{c})=\vec{a}\cdot \vec{b} + \vec{a}\cdot \vec{c}\). However, in scalar multiplication it is not linear and instead we must pull out the conjugate of the scalar, \(\vec{a}\cdot(b\times \vec{c})=\overline{b}\times (\vec{a}\cdot \vec{c})\). It is linear in the first argument, though, which means when you pull out a scalar multiple from the first argument of the inner product, you do not need to take the conjugate of the scalar. In general, it will be antilinear in the argument you are taking the complex conjugate of, and linear in the other one.
What we need is a type of summation that can be performed over continuous intervals where the summation interval can be infinitely small. This sounds like the perfect use case for an integral.
The only restrictions here being that the functions \(f(t)\) and \(g(t)\) must be square integrable over the interval \([0,T]\), which is to say that integrating the function’s absolute value squared is finite over \([0, T]\).
Note
\(L^2\) is the set of square-integrable functions and \(L^2(0, T)\) is the set of square-integrable functions over interval \([0, T]\).
To make this a bit more familiar and similar looking to our previous definition of the dot product in 2D space, we can write this integral as a Reimann Sum (sigma-notation) like so
Where \(\dfrac{T}{N}\) is the equivalent of \(dt\) here. It is the infinitesimally small piece that each step gets multiplied by. Functions \(f\) and \(g\) then take the upper bound \(T\) times the ratio between the current step in the summation and what the limit approaches. This keeps the value \(f\) and \(g\) are taking as a parameter within the integration interval. In lower steps (\(k = 0, 1, 2\), etc) \(\frac{T\times k}{N}\) will be much closer to \(0\) and thus the argument will be much closer \(0\). Where as \(k\) approaches \(N\), \(\frac{T\times k}{N}\) will be closer to \(1\) and as a result be closer to \(T\).
Complex Exponentials as Sines and Cosines
Complex exponentials provide a convenient way for us to easily deal with sines and cosines. There’s a surprising link between the world of trigonometry and the complex plane. The formula that describes that link is called Euler’s Identity. Here is the formula for Euler’s Identity, as promised in the Complex Numbers section.
Where \(x\) describes how far around a circle to travel. For instance, \(e^{\frac{\pi}{4} i}\) goes around the circle \(\frac{\pi}{4}\) radians and ends up at \(\frac{\sqrt{2}}{2} + \frac{\sqrt{2}}{2}i\). Additionally, \(e^{\pi i}\) goes around the circle \(\pi\) radians and ends up at \(-1 + 0i\), which is Euler’s other famous identity:
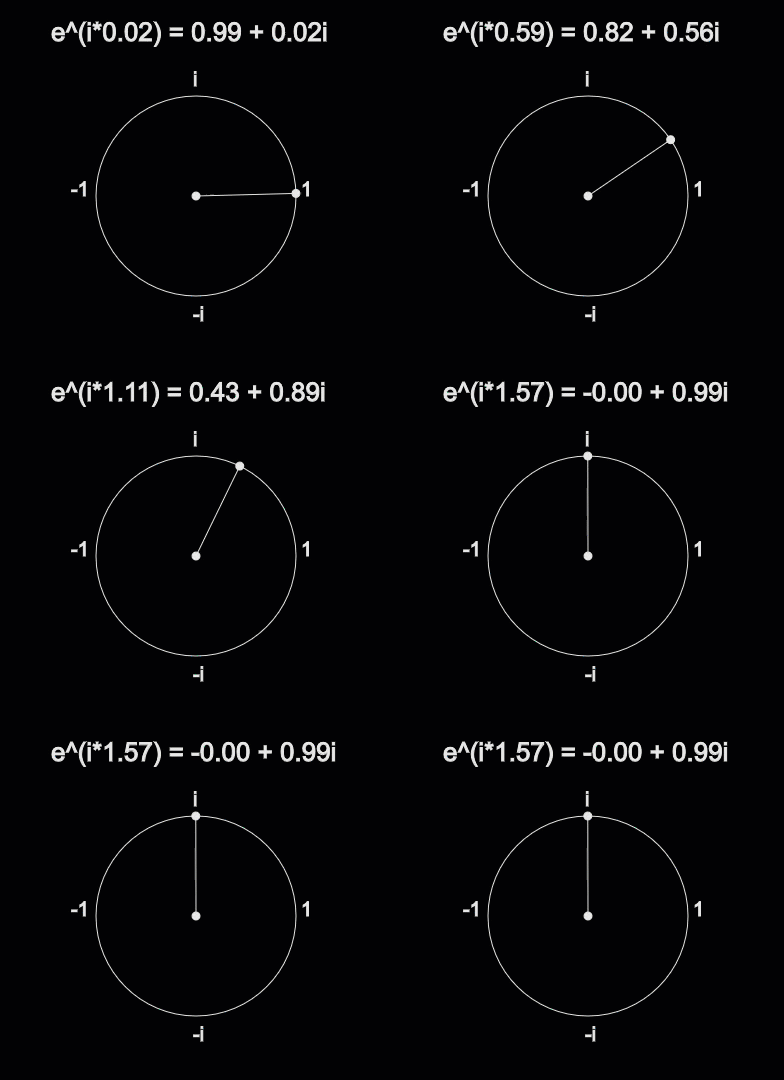
Fig. 10 How \(e^{ix}\) correlates to Trigonometry
Why is this the case? How does raising \(e\) to an imaginary number cause rotation about a unit circle? The answer lies in physics. If the position \(p\) at time \(t\) is
Then the velocity of that point is the first derivative of \(p(t)\).
And that is all we need! The velocity is the same as the position but imaginary instead of real. Multiplying by \(i\) is like rotating counter-clockwise by \(90^{\circ}\). For example, if you have \(a\in\mathbb{R}\), then \(i\times a\) is whatever \(a\) was on the imaginary axis instead. But what if \(a\) was already imaginary? Then you have \(a = i\times k\) where \(k\) is some real number. Multiplying \(a\), then by \(i\) becomes \(i\times a = i^2\times k\). We know by the definition of \(i\) that \(i^2\) is \(-1\), thus \(i\times a = -k\). Since it’s just the negtive of a real number, it’s a \(180^{\circ}\) rotation. Since multiplying by \(i\) is like rotating by \(90^{\circ}\) then the velocity function is always perpendicular to the direction of the current position. The curve this will draw is a circle, and that’s why \(f(t)=e^{it}\enspace \text{where}\enspace t\in [0, 2\pi]\) draws a circle.
Also, note that
Since \(\cos{t}\) and \(\sin{t}\) are orthogonal functions, which makes \(\cos\) and \(\sin\) a basis for the Fourier transform.

Fig. 11 Demonstrating \(\cos\) and \(\sin\) being orthogonal functions.
So essentially what we are doing is a change of basis from the two dimension complex number space \((1,0), (0, 1)i\) to an infinite dimension space with basis functions \((...,e^{i\frac{-4\pi}{T}t}, e^{i\frac{-2\pi}{T}t}, 1, e^{i\frac{2\pi}{T}t}, e^{i\frac{4\pi}{T}t},...)\) which means that we are going from a function producing complex numbers and mapping to a new function producing an infinite dimension complex vector. This can also be represented as an infinite dimension basis on \(\mathbb{R}\) by using Euler’s formula to convert the basis to \((...,\cos(\frac{-2\pi}{T}),\sin(\frac{-2\pi}{T}),1,\cos(\frac{2\pi}{T}), \sin(\frac{2\pi}{T}),...)\). Since this is a linear operation and it’s mapping from one function space to another, it’s what we call a linear operator.
Approximating a Square Wave
Fig. 12 The square wave.
The square wave is sort of like the “hello world” of the signal processing world. A square wave is defined as a \([-\pi, \pi]\) periodic wave where half the period is “on”, or \(1\), and half the period is “off”, or \(0\).
Where sgn is the sign function, defined as so
So we can integrate (inner product of the square wave function and the \(k\)th basis term, same as a change of basis for 2D vectors as described in the Linear Algebra section above) to find the \(k\)th Fourier coefficient of the square wave.
Note
The \(\frac{2\pi}{T}\) term for \(e^{-i \frac{2\pi}{T} k t}\) disappears since \(T=2\pi\).
Since the sign function is discontinuous, we need to separate the integral into a new integral for each case of the sign function.
Fig. 13 The sin wave on the interval from \(-\pi\) to \(\pi\).
As we can see, between \([-\pi, 0]\), the sign of \(\sin(t)\) is negative. At \(0\), it’s \(0\), and between \([0, \pi]\) it’s positive. Therefore the separated integral looks like
The middle term will disappear since the interval is \([0, 0]\) and the integrand is \(0\), and we are left with
Since the \(-1\) can be pulled out of the first integrand, this can be simplified even further to
So we can calculate this integral pretty easily. Recall that
Here we are going to ignore the constant term and just use \(-i e^{i x}\). Since \(k\) is just a constant term, it gets divided. We end up with the following
We have a major problem with this formula, however. We need a value for \(k=0\). This formula, with \(k=0\), would result in a divide by \(0\), which we cannot do. As a result, we need to define \(c_k\) for when \(k=0\) and for when \(k\not = 0\). If we plug \(0\) into \((26)\) then we have \(c_0\).
Now that we have both cases defined we can write it as a piecewise function.
Which is our final equation for the \(k\)th coefficient. We can plug in a few values for \(k\) and see what we get.
Observe that positive and negative corresponding \(c_k\)s have equal magnitudes but opposite directions. So now to get an equation that we can graph to approximate our square wave, we sum each \(c_k\) coefficient multiplied by \(e^{i k t}\).
This equation looks complicated but it can actually be simplified quite a bit further using the following identity
Using the above identity that takes our difference of complex exponentials into just an imaginary sine component, we get the following simplification
Which is a lot cleaner, since our new equation no longer involves any imaginary terms. So now we can go ahead and plot this and see how well it approximates our original square wave function.
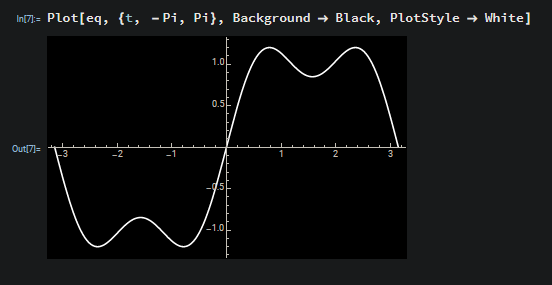
Well, it’s not exactly a square wave yet but the idea is that as we add together more sine waves found in the same manner as above, then we will get the square wave as the number of sine waves we add together approaches infinity. This is what we call the Fourier Series, since it is an infinite summation of sine waves that converges to our original function. You can see in the following picture that as we go from \(7\) coefficients to \(51\) the approximation gets much better.
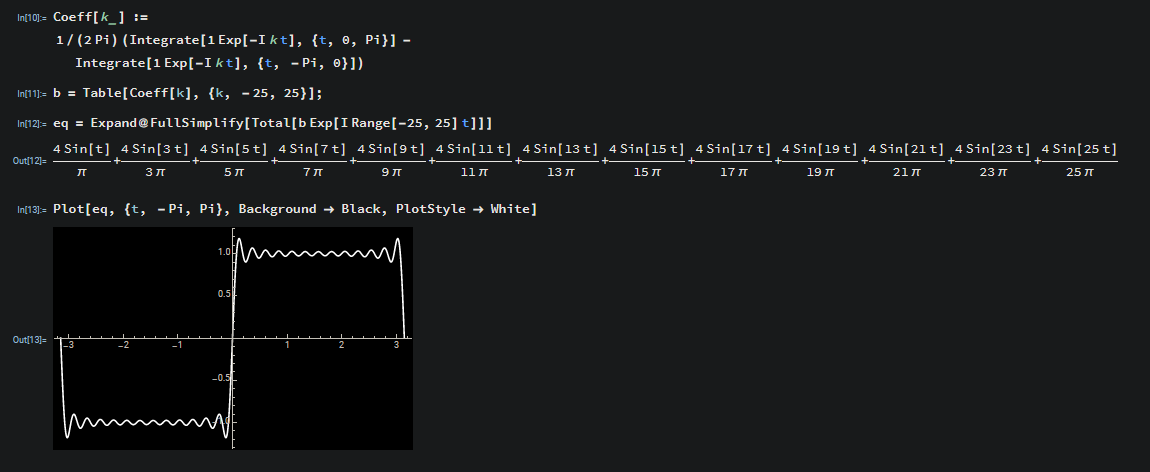
The function goes from having \(2\) sine waves to \(13\). With these additional \(9\) sine waves the graph is actually starting to look a bit like a square wave.
Drawing Llamas
We can use the same principles demonstrated in the section above to draw pretty much anything we want to as long as we can represent it as a closed curve that is fairly smooth. As far as how to go about acquiring a function that represents a llama, there’s two things we can do. We can draw a llama in a vector graphics program and export it as an SVG and then use the SVG since SVGs are just mathematically defined curves (lines, bezier curves, etc). Or, we could take that SVG and sample it at evenly spaced intervals and get a list of sample points and execute a descrete Fourier transformation (DFT) on those sample points to get the Fourier coefficients. For this article, we are going to go with the second option as it’s more straightforward.
const numSamples = 400;
let pts = [];

function entry() {
    const svgUrl = './images/llama.svg';
    const response = await fetch(svgUrl);
    const text = await response.text();
    pts = await sampleSvgPoints(text, numSamples);
}

entry();

// Might not sample exactly numPts number of sample points, but it will be
// close. Not a concern using the O(N^2) DFT. Using FFT, that can be
// concerning since the ideal number of point samples is an exponent of 2.
async function sampleSvgPoints(xml: string, numPts: number): Promise<[number, number][]> {
    const parser = new DOMParser();
    const doc = parser.parseFromString(xml, 'application/xml');
    let samplePts = [];

    const paths = Array.from(doc.querySelectorAll('path'));
    const totalLength = paths.reduce((acc, v) => acc + v.getTotalLength(), 0);
    const step = (totalLength / numPts);
    paths.forEach(path => {
        const sample = [];
        const n = M.floor(path.getTotalLength());
        for (let i = 0; i < n; i += step)
            sample.push(toPt(path.getPointAtLength(i)));
        samplePts = samplePts.concat(sample);
    });
    while (samplePts.length > numPts)
        samplePts.pop();

    return samplePts;
}

function toPt(pt: SVGPoint): [number, number] {
    return [pt.x, pt.y];
}
Sampling an SVG for points So then we run the Discrete Fourier Transform (DFT) on those sampled points to find the Fourier coefficients that we want just like for the square wave above. The Discrete Fourier transform equation is the following
Where \(N\) is the total number of sample points in our list of sample points we want to transform. For our use case \(p(k)\) is just going to be keying an array essentially. For example, if \(p\) is our list of sample points, then in Javascript it would just be p[k]. The DFT is really the same thing as the Fourier series except we are summing evenly spaced definite samples rather than having a limit as the change between steps reaches \(0\), or equally stated the number of terms being summed aproaches \(\infty\). The DFT also is a way to convert \(N\) evenly spaced sample complex points in the time domain into their representation in the frequency domain. That is, figuring out the strengths of each whole number sinusoidal frequency. This is the direct application of the change of basis to the \(N\)-dimensional basis \((...,e^{i\frac{-4\pi}{T}t}, e^{i\frac{-2\pi}{T}t}, 1, e^{i\frac{2\pi}{T}t}, e^{i\frac{4\pi}{T}t},...)\) as explained a few sections ago in the Complex Exponentials as Sines and Cosines section.
We can implement the DFT fairly easy using two loops, the outer loop calculating each coefficient \(c_k\), and the inner loop doing the numerical integration summation and dividing by \(N\) to get the average strength of each frequency \(k\). This approach is very slow, but will work for decently small numbers of points. This ends up being \(\mathcal{O}(kj)\) which at worst case will be \(\mathcal{O}(N^2)\). We can do much better than this with more efficient algorithms, like the Radix-2 Fast Fourier Transform (FFT) which is on average \(\mathcal{O}(N\log(N))\), however this article is already getting lengthy so that can be a topic for a future article.
import * as M from 'mathjs';

export type DFTData = M.Complex & {
    freq: number;
    radius: number;
    phase: number;
};

export async function dft(cps: M.Complex[]): Promise<DFTData[]> {
    const X = [];
    const N = cps.length;
    for (let i = 0; i < N; i++) {
        let sum = M.complex('0');
        for (let n = 0; n < N; n++) {
            const xn = cps[n];
            const theta = -(2 * M.pi * i * n) / N;
            const c = M.complex(`${M.cos(theta)}+${M.sin(theta)}i`);
            sum = M.add(sum, M.multiply(xn, c)) as M.Complex;
        }
        const { re, im } = M.multiply(1 / N, sum) as M.Complex;
        X.push({
            re,
            im,
            freq: i,
            radius: M.sqrt((re * re) + (im * im)),
            phase: M.atan2(im, re)
        });
    }
    return X;
}
\(\mathcal{O}(N^2)\) DFT implementation in TypeScript.
Now that we have the coefficients, we can parameterize the curve so we can plot it.
function parameterize(cn: M.Complex[]) {
    return async (t: number): Promise<M.Complex> =>
        await sigma(k =>
            M.multiply(M.complex(cn[k - 1].re, cn[k - 1].im),
                M.exp(M.multiply(M.i, (k - 1) * t))), [1, numSamples]) as M.Complex;
}
So what we should see from this parameterization of our approximation of a llama is that as the number of sinusoids increases, it will more accurately represent a llama. We can see this in the following animation. Note that “modes” refers to the number of positive frequencies used, and we are also using the \(0\) frequency as well as the corresponding negative frequencies. Thus the number of circles is \(\text{\# of modes}\times 2\).
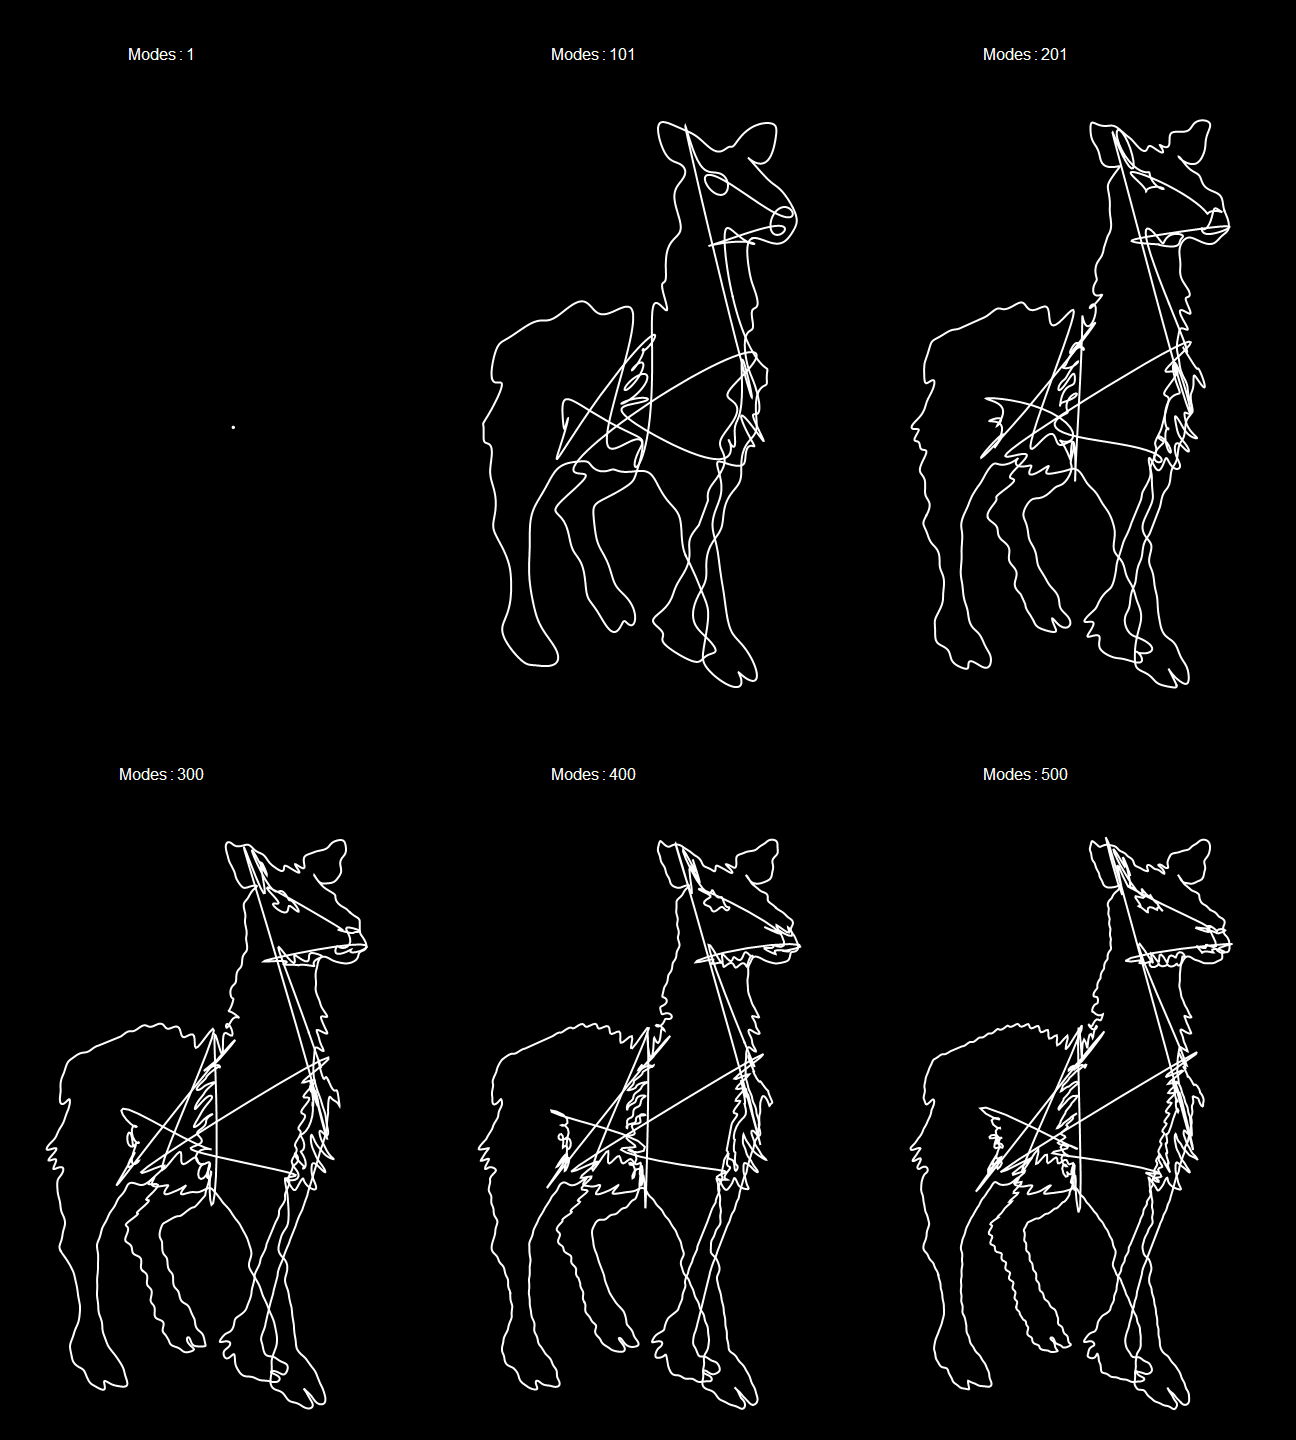
Fig. 14 \(1\to500\) modes of a llama approximation.
From this animation, we can see that most of the work is done in the lower frequencies since it very quickly becomes llama-like. As we add more and more of the higher frequencies, the smaller details of the llama start filling in and the approximation becomes slowly more crisp.
In order to recreate the image at the beginning of the article, with the circles moving around in organized chaos drawing the outline of the llama, we need some code to go through and draw each frequency’s circle. To do that we need the radius and phase which we have included in the DFTData type in the first code block. To do the actual graphics representation, we’ll be using the p5.js library. Note that the code depends on variables defined in the above code blocks. I’ll also provide the full source at the end.
function draw() {
    for (let i = 0; i < complex.length; i++) {
        const cn = complex[i];
        const prevx = x;
        const prevy = y;
        const { freq, radius, phase } = cn;
        x += radius * M.cos(freq * time + phase);
        y += radius * M.sin(freq * time + phase);

        stroke(230, 85);
        noFill();
        ellipse(prevx, prevy, radius * 2);
        stroke(230, 142);
        line(prevx, prevy, x, y);
    }
    points.push(createVector(x, y));
    stroke(230);
    noFill();
    beginShape();
    for (let i =0 ; i < points.length; i++)
        vertex(points[i].x, points[i].y);
    endShape();
    if (time > M.pi * 2)
        points.pop();

    time += ((2 * M.pi) / pts.length);
}
Which will draw for us the very same animation shown at the beginning of the article.

The complete source for the Fourier animations can be found here: